The global air passenger market recorded 25.3% YoY growth in December with global passenger load factor at 82.3%, a little less than 2019 levels, as per the International Air Transport Association (IATA). TravelBiz Monitor presents highlights of the analysis.

2023 was marked by strong industry-wide recovery Strong demand for air travel continued to propel the recovery of
passenger markets in 2023. The total industry achieved a remarkable 36.9% year-on-year (YoY) growth, as traffic, measured in revenue passenger-kilometer (RPKs), reached 94.1% of 2019 levels, a significant increase from 2022 when it stood at 68.7%. The supply of seats slightly exceeded the demand for travel compared to 2019 (pre-pandemic), resulting in an industry-wide load factor of 82.3%, which was only 0.3 ppt lower than the load factor in 2019.
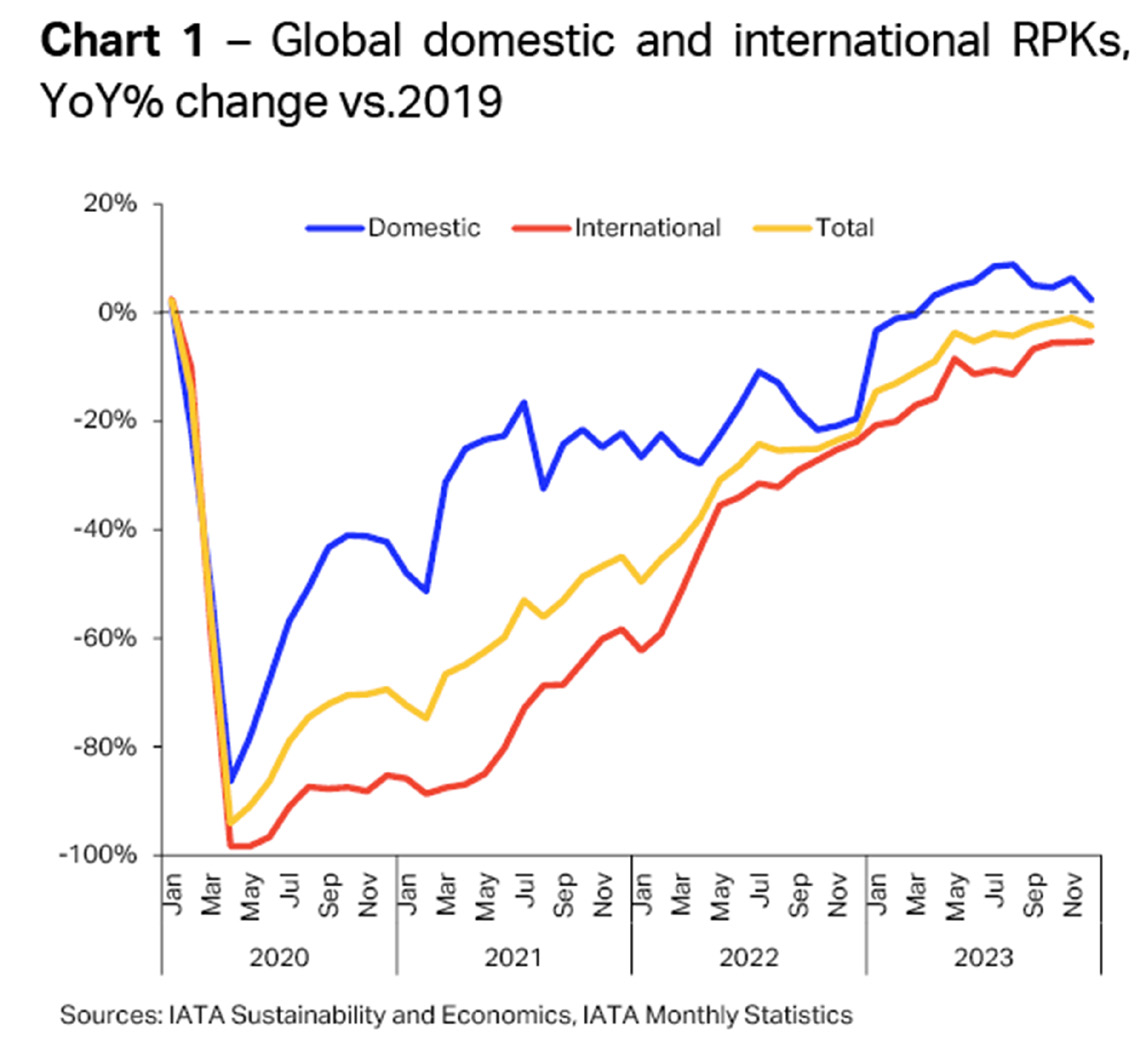
Domestic traffic set new highs in 2023, most of the monitored markets surpassed the pre-pandemic levels by mid-2023. The definitive reopening of China in January 2023 shaped the industry’s recovery profile as total domestic RPKs remained largely above pre-pandemic levels for most of the year reflecting the buoyant activity this major
market has observed (Error! Reference source not found.). In 2023, total domestic RPKs grew 30.4% YoY and stood 3.9% over 2019 levels. On the other hand, international traffic remained lower than its levels of 2019 while maintaining a stable yet robust growth pace. Industry-wide international RPKs increased 41.6% YoY and totaled 88.6% of pre-Covid levels. Although airlines across the globe saw various outcomes, all regions contributed to those developments by achieving resilient growth in international passenger traffic. Asia Pacific airlines more than doubled their RPKs, growing 126.1% compared to 2022, overcoming a large part of the setback caused by past strict travel restrictions, however, they remained 27.3% under pre-pandemic levels. On the other hand, North American carriers have surpassed their 2019 record by 1.4%, leading the regions in terms of international recovery.
While the airline industry had recovered the majority of its traffic 2019 levels as of December 2023, network restoration remained relatively uneven as connectivity and passenger demand to and from Asia Pacific has not yet reached its pre-pandemic status. Industry-wide growth was resilient in December…

Air passenger traffic, measured in RPKs, increased 25.3% YoY in December. Compared to the same month in 2019, traffic levels in 2023 were 2.5% lower. In seasonally adjusted terms, RPKs grew 1.3% monthon-month (MoM) aligning with the pace the industry saw over the past year, thus demonstrating the ongoing positive trend (Chart 2).
Industry seat capacity, measured in ASKs, grew by 24.1% compared to December 2022 and reached 97.5% of pre-pandemic levels. Passenger load factors (PLF) remained in the vicinity of 2019 levels (Chart 3). Industry-wide seat occupation was 0.8 ppt superior to the previous year and in line with the December 2019 number.

The same observation applied to most regions, showing the alignment between demand for air travel and airline seat capacity globally. Asia Pacific and North American carriers saw slightly lower load factors compared to the same month in 2019, a result driven by seat supply outpacing passenger numbers in China and US domestic markets respectively. Europe led among the regions, exceeding December 2019 PLF by 2.1ppt as RPKs surpassed the pre-pandemic threshold by 2.0%, for the first time since 2020 (Chart 3) . …while total domestic traffic expansion continued globally and most markets
Total domestic RPKs grew 27.0% YoY while maintaining a strong positive course in seasonally adjusted terms. RPKs were 2.3% above pre-pandemic levels, a lower result compared to the level observed in November 2023 that reflects the latest traffic numbers in US (Chart 4). US domestic traffic increased 9.6% YoY and 0.4% over December 2019 RPKs. This is a large variation in perspective to the last months, especially in comparison to November 2023 when growth over the latest pre-pandemic year had reached 9.2%. In December 2019, domestic RPKs had increased by 9.9% YoY thus standing out from the previous observations of the pre-Covid years. Consequently, this market has not seen any sign of slowdown (Chart 4).
PR China domestic traffic increased more than twofold, surging 147.1% YoY and exceeding 2019 numbers by 8.4%. Passenger load factor was 13.4ppt higher than the past year, however, 3.3ppt lower than in 2019, still reflecting the large improvements this market has seen from the last Covid year and traffic expansion in comparison to 2019 (Chart 4). In India domestic traffic also continued to expand, increasing 8.2% over the year and surpassing pre-pandemic levels by 6.0%. Somewhat mirroring the economic situation and slowing domestic consumption, domestic RPKs contraction is confirmed in Japan. In seasonally adjusted terms, passenger numbers decreased on average 1.3% per month. Nevertheless, RPKs were 0.9% superior to December 2022 and 7.9% lower than pre-pandemic.
Australia domestic RPKs increased 6.6% over the year and sat 7.6% under pre-Covid levels. Brazil saw 5.9% YoY growth in domestic RPKs. Traffic continued to trend around pre-pandemic levels (Chart 4).
International passenger traffic recovery remained stable in December
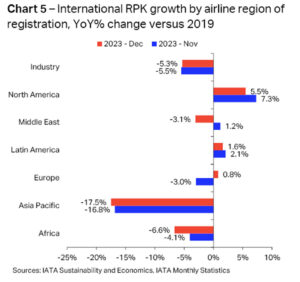
International traffic growth saw only modest changes from the previous month, RPKs saw 24.2% yearly growth while sitting 5.3% under pre-Covid numbers. Regions also experienced minor developments in terms of growth while maintaining an upward trajectory in seasonally adjusted terms, however, sustaining their growth momentum in terms growth over 2019 levels. North American carriers continued to lead, increasing their performance by 5.5% over 2019 levels. Europe saw monthly recovery in international traffic for the first time, surpassing December 2019 RPKs by 0.8%. International RPKs performed by Latin American carriers still trend above pre-Covid levels as December levels were 1.6% higher than the same month in 2019 (Chart 5). These three regions continued to see solid growth compared to the same month in 2022. Europe international RPKs grew 13.6% YoY while North American
and Latin American carriers saw 13.5% and 26.5% YoY growth.
Airlines in Africa experienced the lowest increase in international RPKs among the regions, nevertheless close to double-digit growth. RPKs grew 9.5% YoY and reached 93.4% of pre-Covid levels. Middle Eastern carriers’ international traffic fared near its pre-pandemic levels, totaling 96.9% of December 2019 RPKs.
Following a swift recovery in early 2023 and the end of 2022, Asia Pacific’s international passenger numbers have been trending roughly sideways since July 2023 in terms of recovery to 2019 levels. Nonetheless, the region saw the highest yearly growth again in December, with RPKs increasing 56.9% YoY